Ansible metrics with Prometheus
ara doesn’t provide monitoring or alerting out of the box (they are out of scope) but it records a number of granular metrics about Ansible playbooks, tasks, results and hosts.
The ara prometheus command exposes a subset of these as
Prometheus metrics so you can graph them in
Grafana and alert on them with
Alertmanager.
For example, alerts could fire when playbooks start failing or if hosts become unreachable. It makes it possible to visualize playbook status across python or ansible versions, users and controllers:
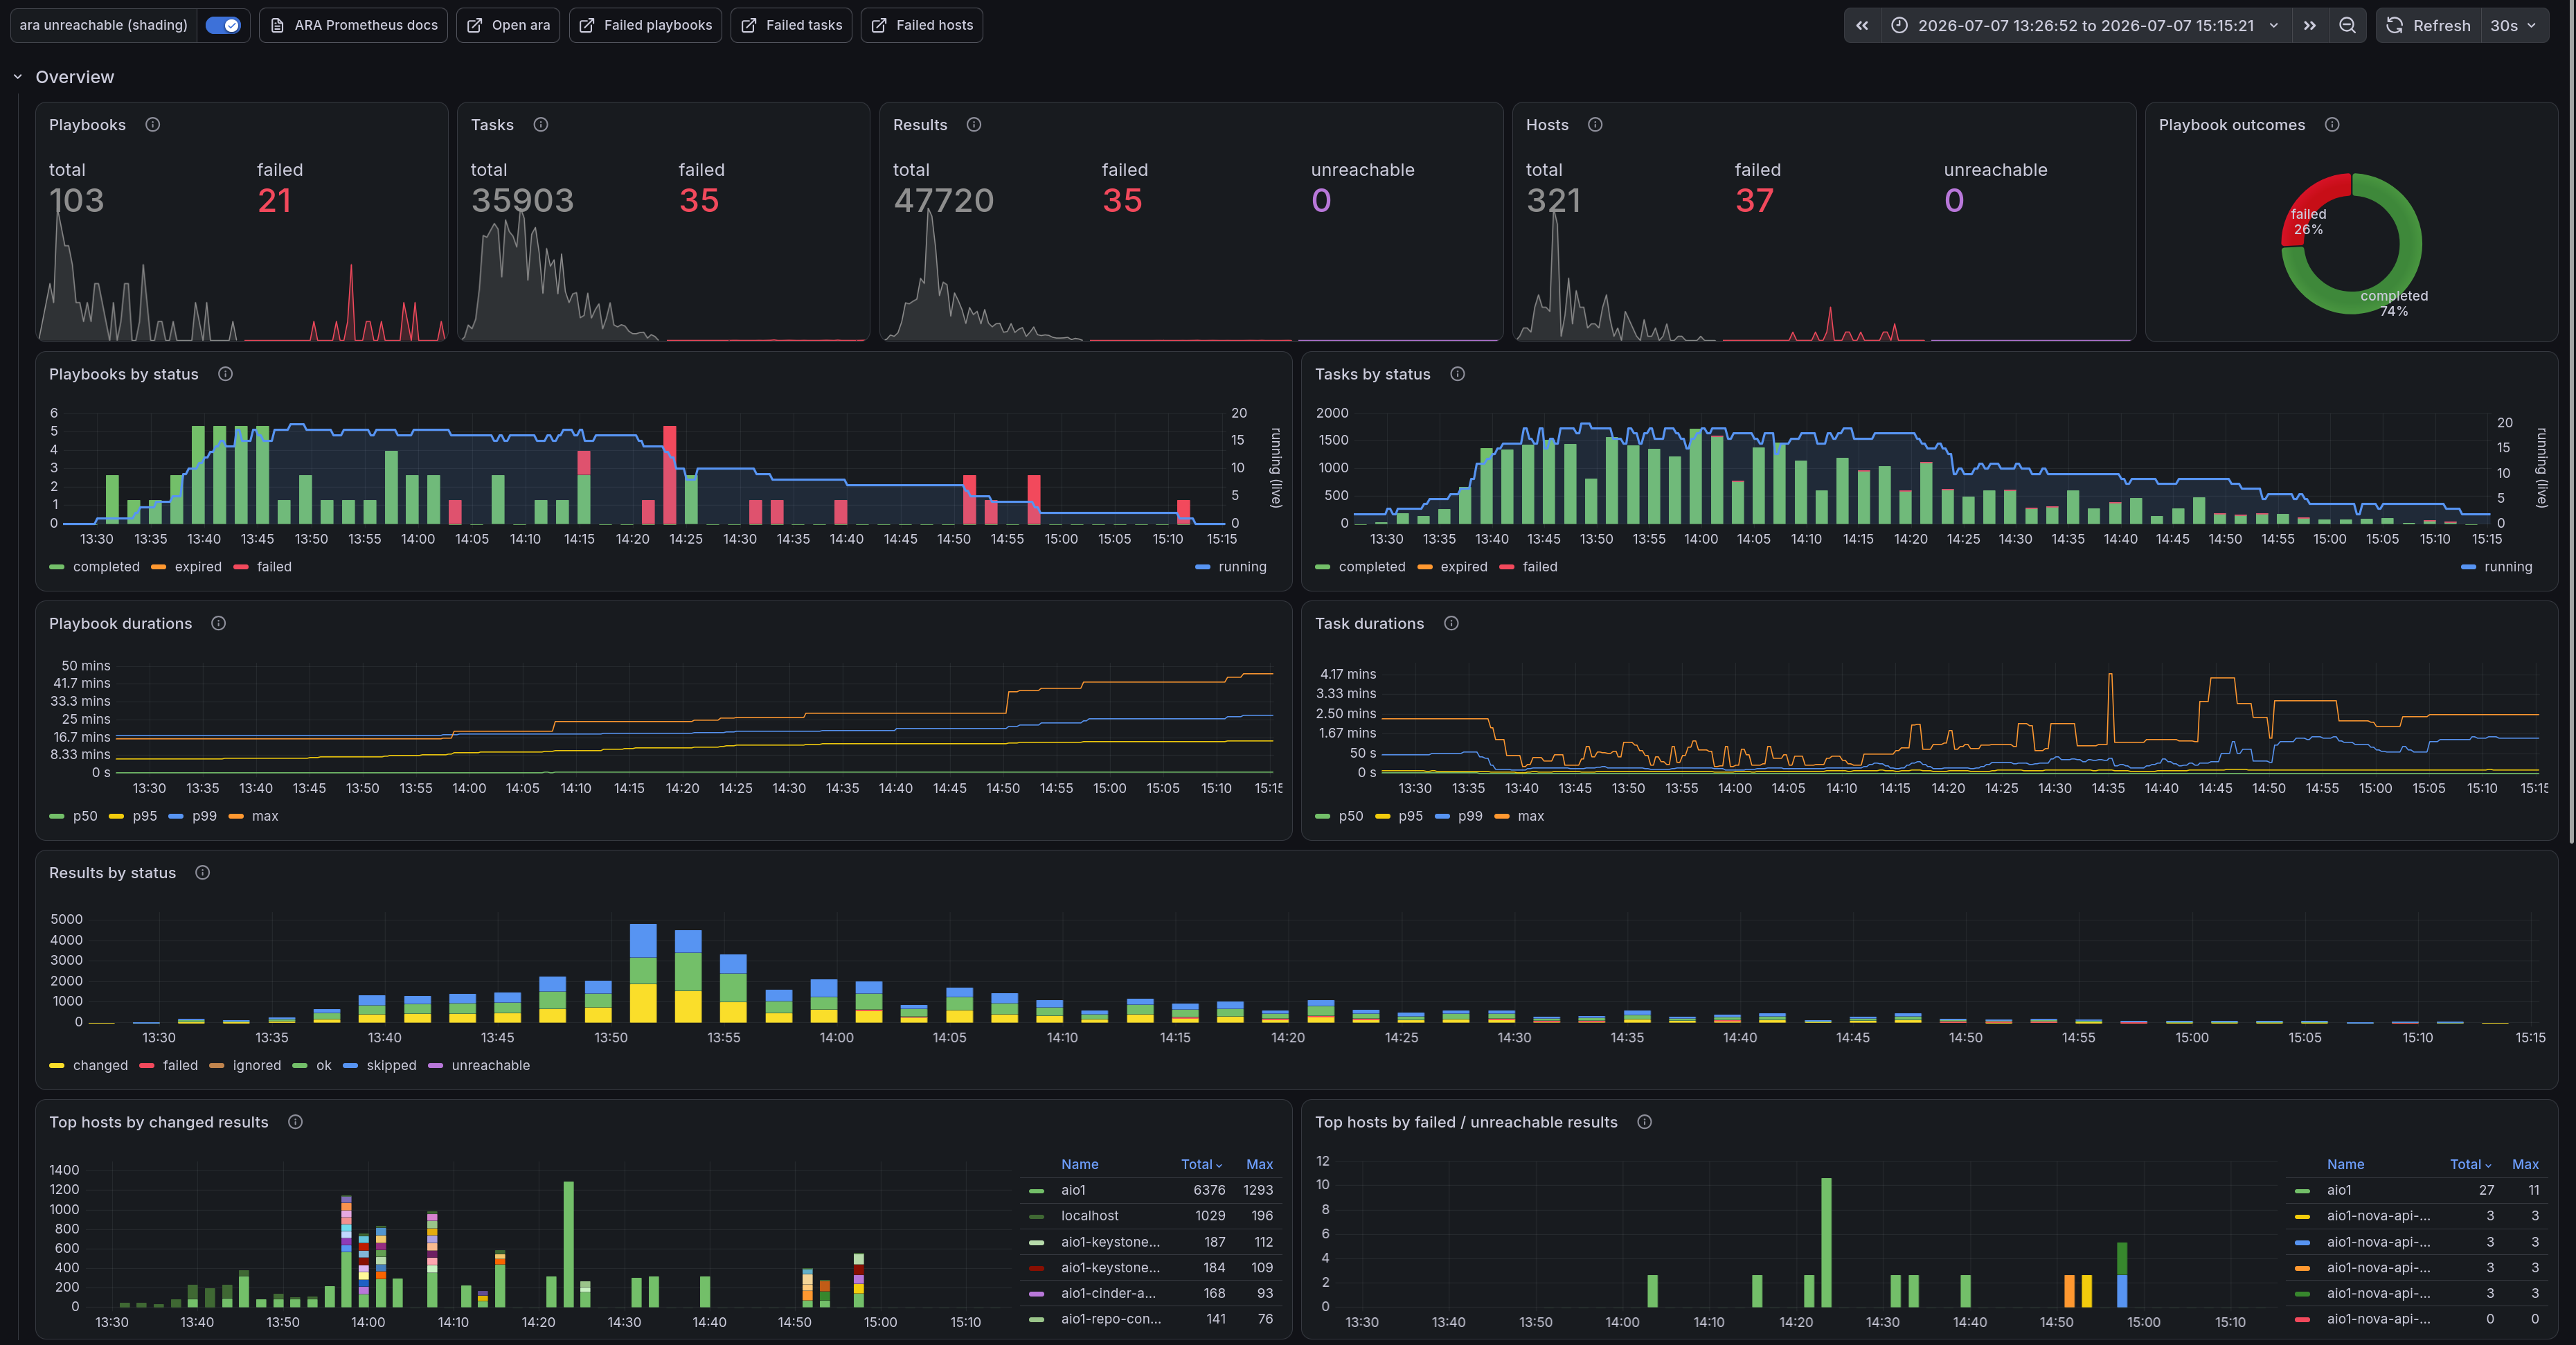
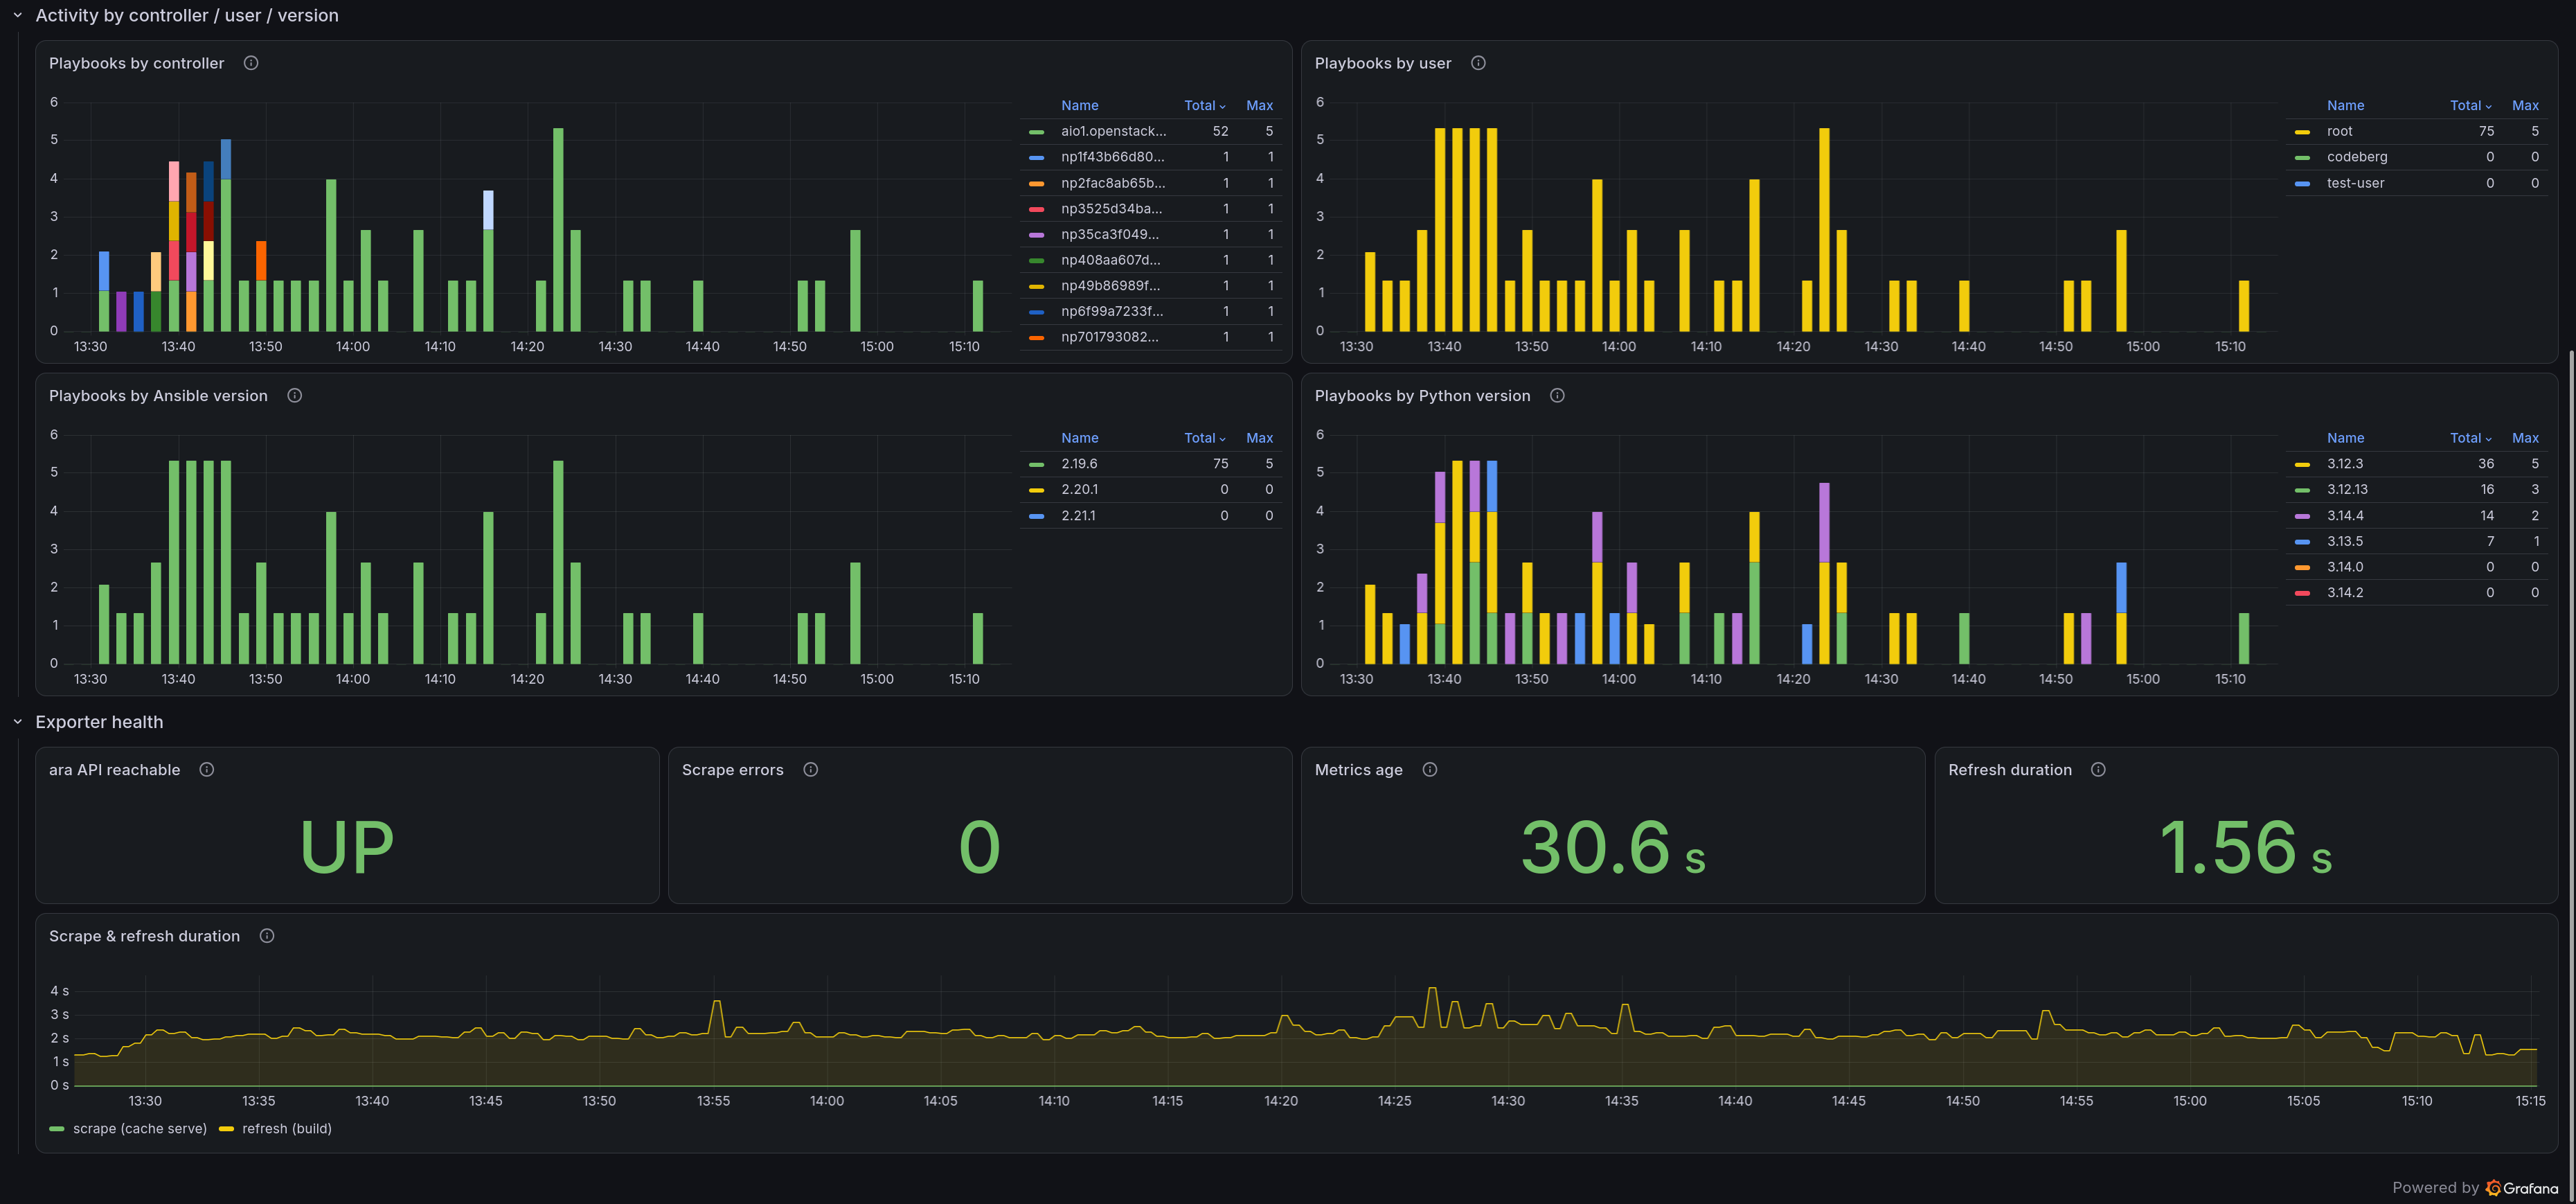
(open images in a new window for full resolution)
This documentation is about using the prometheus exporter. Historical and developer-oriented documentation about design and rationale is available in the source repository.
How it works
The exporter is a prometheus_client custom collector. On a
background interval it queries the ara API, builds the full set of metrics and
caches them in memory; every Prometheus scrape of /metrics is answered
from that cache.
┌────────────┐   promql   ┌─────────┐   ┌──────────────────┐
│ Prometheus │◄───────────┤ Grafana │   │ ansible-playbook │
└──────┬─────┘            └─────────┘   │    (with ara)    │
       │                                └────────┬─────────┘
       │ scrapes /metrics                        │ records playbooks
       │                                         │
┌──────▼───────────────┐    queries     ┌────────▼───────┐
│  ara prometheus      ├───────────────►│  ara API / DB  │
│  (exporter)          │    metrics     │                │
└──────────────────────┘                └────────────────┘
Getting started
The exporter is not an API server component and does not require an API server
to run. It can read directly from a local ara database (the default
offline client) or query a remote ara API server over HTTP.
Reading from a local ara database:
# Install ara, ansible and prometheus_client in a virtual environment
python3 -m venv ~/venv/ara
source ~/venv/ara/bin/activate
pip install ansible "ara[server,prometheus]"

# Run and record a playbook
export ANSIBLE_CALLBACK_PLUGINS=$(python3 -m ara.setup.callback_plugins)
ansible-playbook playbook.yml

# Start the exporter; metrics are now on http://0.0.0.0:8001/metrics
ara prometheus
Querying a remote ara API server (ansible and the server dependencies are not required here):
python3 -m venv ~/venv/ara
source ~/venv/ara/bin/activate
pip install "ara[prometheus]"

export ARA_API_CLIENT=http
export ARA_API_SERVER=https://ara.example.org
ara prometheus
Then point Prometheus at it (a ready-to-use example is in contrib/prometheus/prometheus.yml:
global:
  scrape_interval: 30s

scrape_configs:
  - job_name: ara
    static_configs:
      # Replace with wherever the exporter is listening, relative to Prometheus
      - targets: ['localhost:8001']
Metrics become available as soon as Prometheus successfully scrapes once.
Available metrics
Status counts (whole database):
# Playbooks by status (completed, failed, running, expired, unknown)
ara_playbooks{status="completed"} 128.0
ara_playbooks{status="failed"} 3.0

# Tasks by status
ara_tasks{status="failed"} 12.0

# Task results by status (ok, failed, skipped, unreachable, unknown)
ara_results{status="ok"} 5821.0
ara_results{status="failed"} 12.0
ara_results{status="unreachable"} 1.0

# ara derives the status it displays from the stored status plus two
# booleans: an ok result with changed=true is reported as "changed", and a
# failed result with ignore_errors=true as "ignored". The exporter mirrors
# that, so these statuses partition the results the same way ara's UI shows.
ara_results{status="changed"} 240.0
ara_results{status="ignored"} 3.0

# Total host records (a host record is per host, per playbook). The
# per-status host outcome numbers live in the ara_hosts_by_hostname
# breakdown below; sum that for host outcome totals.
ara_hosts 342.0
Recent-window breakdowns (most recent --playbook-limit playbooks):
# Number of playbooks the breakdowns below are computed from
ara_playbooks_window 1000.0

# Playbooks grouped by controller and status
ara_playbooks_by_controller{controller="ci-runner-01",status="completed"} 240.0
ara_playbooks_by_controller{controller="bastion.prod",status="failed"} 2.0

# Playbooks grouped by ansible_version and status
ara_playbooks_by_ansible_version{ansible_version="2.17.6",status="completed"} 410.0

# Playbooks grouped by python_version and status
ara_playbooks_by_python_version{python_version="3.12.3",status="completed"} 388.0

# Playbooks grouped by user and status
ara_playbooks_by_user{user="deploy",status="completed"} 305.0

# Running totals of playbooks recorded, grouped the same way. Unlike the
# by_* gauges above (a current-window snapshot), these are monotonic
# counters, so Grafana uses increase()/rate() on them for exact activity
# over a range. Use these to graph activity; use the gauges to see the
# current mix (e.g. the ansible_version mix during an upgrade).
ara_recorded_playbooks_by_controller_total{controller="ci-runner-01",status="completed"} 24012.0
ara_recorded_playbooks_by_ansible_version_total{ansible_version="2.17.6",status="completed"} 41090.0
ara_recorded_playbooks_by_python_version_total{python_version="3.12.3",status="completed"} 38855.0
ara_recorded_playbooks_by_user_total{user="deploy",status="completed"} 30512.0

# Playbook duration distribution over the window (a gauge histogram, in
# seconds) plus the exact max. Grafana can compute quantiles from the
# buckets with histogram_quantile() and the average as _gsum / _gcount.
ara_playbook_duration_seconds_bucket{le="30"} 812.0
ara_playbook_duration_seconds_bucket{le="+Inf"} 1000.0
ara_playbook_duration_seconds_gcount 1000.0
ara_playbook_duration_seconds_gsum 14200.0
ara_playbook_duration_seconds_max 311.7
Per-hostname breakdown (per-hostname sums over the most recently updated host
records, up to --host-limit of them):
# Number of host records the per-hostname series below were summed from
ara_hosts_window 342.0

# Each hostname's ok / changed / failed / skipped / unreachable counters,
# summed over its recent host records (one row per host per playbook). Scope
# to a time range in Grafana with clamp_min(delta(...), 0).
ara_hosts_by_hostname{hostname="web.example.org",status="ok"} 529.0
ara_hosts_by_hostname{hostname="web.example.org",status="skipped"} 1300.0
ara_hosts_by_hostname{hostname="web.example.org",status="failed"} 1.0
Exporter health:
# 1 if ara was reachable on the last refresh, 0 otherwise
ara_up 1.0
# Time the last refresh spent querying ara and building metrics
ara_refresh_duration_seconds 0.42
# Age of the metrics being served (time since the last successful refresh)
ara_metrics_age_seconds 12.0
# Time spent answering this scrape (near-zero when served from cache)
ara_scrape_duration_seconds 0.0004
# Number of refreshes that failed to collect from ara
ara_scrape_errors_total 0.0
Freshness and links:
# Unix start time of the most recently started playbook (any status).
# Alert on time() minus this to detect that automation has stopped.
ara_last_playbook_started_timestamp_seconds 1.7831556e+09

# Unix start time of the oldest playbook still in the running state.
# Alert on time() minus this to catch playbooks stuck running.
# (Absent when nothing is currently running.)
ara_running_playbook_oldest_started_timestamp_seconds 1.783152e+09

# The ara web address the exporter is reading from, in a label (value is
# always 1). Emitted only with the http client; used as a Grafana variable
# to link panels back to the ara web UI.
ara_api_server{server="https://demo.recordsansible.org"} 1.0
A note on querying for failures over time
The ara_* counts are gauges that reflect the number of rows currently in
the database. To count “how much new activity happened in a window”, use
delta() rather than increase(). delta() is the gauge-appropriate
function (plain first-to-last difference over the range), whereas increase()
is for counters: on a gauge it treats a decrease (for example when a prune or
expiry job removes old rows) as a counter reset and adds it back, producing
spurious spikes and false alerts right after a prune. New playbook runs only add
rows and pruning only removes old rows, so delta() over a short window
reliably reflects newly recorded activity. For example, new task failures in the
last 15 minutes:
delta(ara_results{status="failed"}[15m])
The one genuine counter among the whole-database counts, ara_scrape_errors_total,
is the exception and should be queried with increase().
For the recent playbook breakdowns there is also a set of true counters,
ara_recorded_playbooks_by_controller_total and friends. These are monotonic,
so increase() on them gives exact activity per controller / user / version,
without the small inaccuracies delta() on the equivalent ara_playbooks_by_*
gauges has when the recent window is saturated. Prefer them when graphing or
alerting on activity broken down by one of those labels; use the gauges to see
the current mix.
Grafana dashboard
A starter dashboard is provided in contrib/grafana/ara-dashboard.json.
Since every metric is a gauge of current state, the dashboard is built around activity in the selected time range rather than database totals: the stat panels show how much was recorded in the range (with sparklines), and the breakdowns show per-interval activity as stacked bars. These remain readable when playbooks run intermittently, since quiet periods are simply empty so it answers “what is happening now” rather than “how much is in the database”. The overview stat boxes each pair a total with its failure count (playbooks with failed, results and hosts also with unreachable) so failures are visible at a glance without separate panels. It has an overview section (playbook outcomes donut, playbook and result activity split by status, top hosts by changed and by failed / unreachable results from host records updated in the range, and duration percentiles), a section breaking playbooks down by controller / user / ansible version / python version, and exporter health. Import it in Grafana and select your Prometheus data source when prompted.
Everyone is encouraged to tweak it to their needs. Feel free to open a pull request if you improve it.
Alerting
Example Prometheus alerting rules are provided in contrib/prometheus/ara-alerts.yml and cover the cases most relevant to production monitoring:
the exporter being down, unable to reach ara, or serving stale metrics (refreshes persistently failing),
new playbook and task result failures (including a per-controller variant for routing alerts to the right team),
a sustained high playbook failure ratio,
unreachable hosts,
and an optional watchdog for when no new playbooks have been recorded in a while.
Load them from your prometheus.yml and wire up Alertmanager:
rule_files:
  - ara-alerts.yml

alerting:
  alertmanagers:
    - static_configs:
        - targets: ['localhost:9093']